

Time Series Anomaly Pattern Recognition Based on Adaptive k Nearest Neighbor
-
摘要:
时间序列作为数据的典型代表,被广泛应用于许多研究领域. 时间序列异常模式代表了一种特殊情况的出现,在许多领域都具有重要意义. 现有的时间序列异常模式识别算法大多只是单纯检测异常子序列,忽略了异常子序列的类别区分问题,且许多参数都需要人为设置.为此提出了一种基于自适应k近邻的异常模式识别算法(anomaly pattern recognition algorithm based on adaptive k nearest neighbor, APAKN). 首先,确定各子序列的自适应k近邻值,引入自适应距离比计算子序列的相对密度,确定异常分数;然后提出一种基于最小方差的自适应阈值方法确定异常阈值,检测出所有异常子序列;最后,对异常子序列进行聚类,所得聚类中心即为具有不同变化趋势的异常模式. 整个算法过程在无需设置任何参数的情况下,不仅解决了密度不平衡问题,还精简了传统基于密度异常子序列检测算法的步骤,实现良好的异常模式识别效果. 在时间序列数据集合UCR的10个数据集上的实验结果表明, 提出算法在无需设置参数的情况下,在异常子序列检测和异常子序列聚类问题中都表现良好.
Abstract:As a typical representative of data, time series is widely used in many research fields. The time series anomaly pattern represents the emergence of a special situation, and is of great significance in many fields. Most of the existing time series anomaly pattern recognition algorithms simply detect anomaly subsequences, ignoring the problem of distinguishing the types of anomaly subsequences, and many parameters need to be set manually. In this paper, an anomaly pattern recognition algorithm based on adaptive k nearest neighbor(APAKN) is proposed. Firstly, the adaptive neighbor value k of each subsequence is determined, and an adaptive distance ratio is introduced to calculate the relative density of the subsequence to determine the anomaly score. Then, an adaptive threshold method based on minimum variance is proposed to determine the anomaly threshold and detect all anomaly subsequences. Finally, the anomaly subsequences are clustered, and the obtained cluster centers are anomaly patterns with different changing trends. The whole algorithm process not only solves the density imbalance problem without setting any parameters, but also simplifies the steps of the traditional density-based anomaly subsequence detection algorithm to achieve a good anomaly pattern recognition effect. Experimental results on the 10 data sets of UCR show that the proposed algorithm performs well in detecting anomaly subsequences and clustering anomaly subsequences without setting parameters.
-
-
![]()
图 7 50words数据集在不同类别下的异常子序列示例和异常模式
Figure 7. Examples of anomaly subsequences and anomaly patterns in different categories of the 50words dataset
![]()
图 8 CBF数据集在不同类别下的异常子序列示例和异常模式
Figure 8. Examples of anomaly subsequences and anomaly patterns in different categories of the CBF dataset
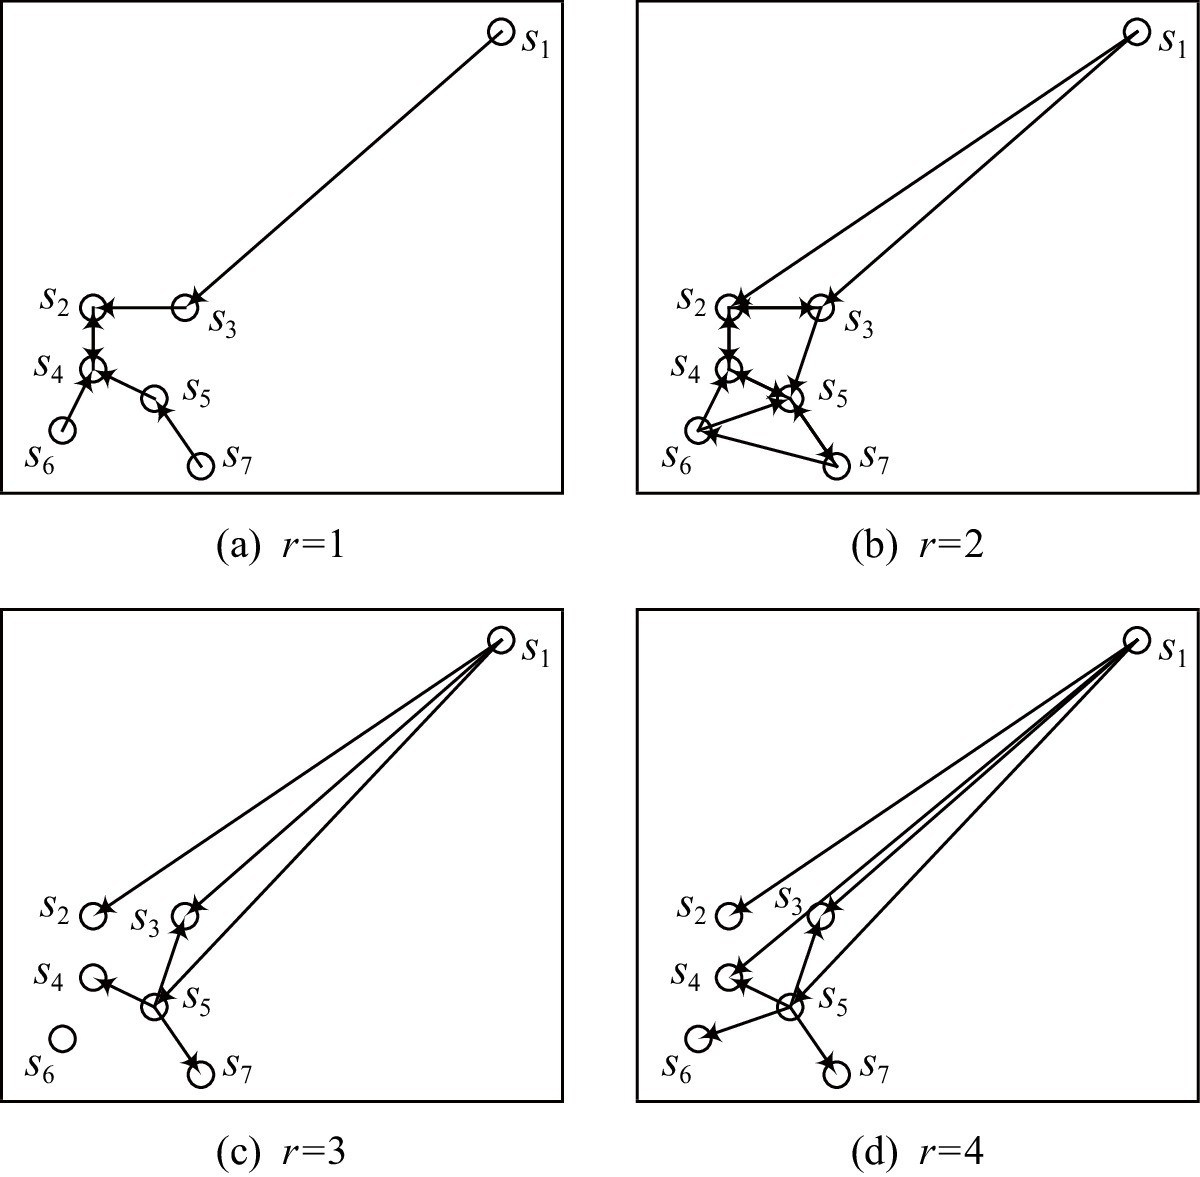
表 1 k = 4时子序列的k近邻域与反向k近邻域
Table 1 k Near Neighbors Domain and Reverse k Near Neighbors Domain of Subsequences when k = 4
子序列 k近邻域 反向k近邻域 反向k近邻个数 s1 {s3,s2,s5,s4} ∅ 0 s2 {s4,s3,s5,s6} {s1,s3,s4,s6} 4 s3 {s2,s5,s4,s7} {s1,s2,s4,s5,s7} 5 s4 {s2,s5,s6,s3} {s1,s2,s3,s5,s6,s7} 6 s5 {s4,s7,s3,s6} {s1,s2,s3,s4,s6,s7} 6 s6 {s4,s5,s2,s7} {s2,s4,s5,s7} 4 s7 {s5,s6,s4,s3} {s3,s5,s6} 3  下载: 导出CSV
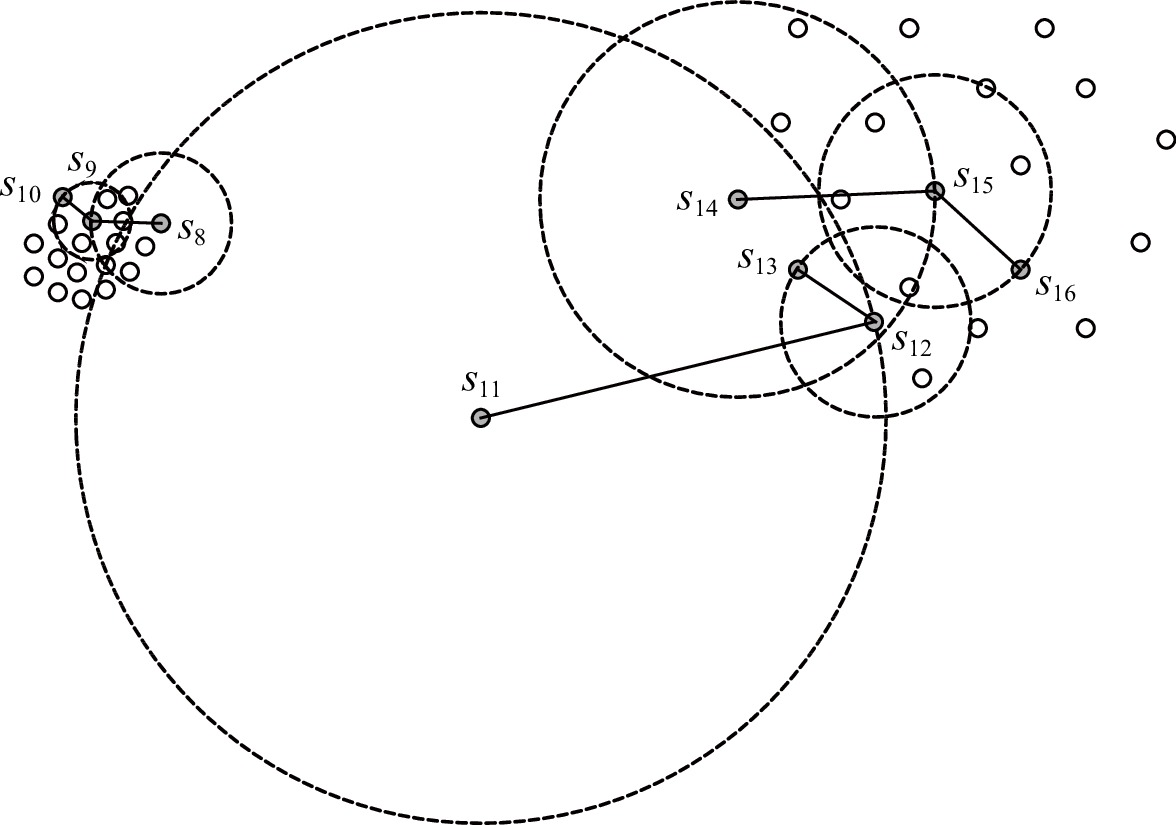
表 2 s8, s11, s14相对于其第8近邻的自适应距离比
Table 2 Adaptive Distance Ratio of s8, s11, s14 Relative to Its 8th Nearest Neighbor
子序列si si第8近邻s8i s8i自适应k近邻值k8i s8i的第k8i近邻 自适应距离比 s8 s9 6 s10 adr(s8,s9)=ddtw(s8,s9)ddtw(s9,s10)=1.833 s11 s12 3 s13 adr(s11,s12)=ddtw(s11,s12)ddtw(s12,s13)=4.266 s14 s15 6 s16 adr(s14,s15)=ddtw(s14,s15)ddtw(s15,s16)=1.722
下载: 导出CSV
表 3 实验数据集
Table 3 Experimental Data Sets
数据集 子序列
长度类别
个数正常类
别号异常类
别号子序列
个数异常率/% 50words 270 50 2 4,10,43 905 20 ECG5000 140 5 1 2,5 5000 10 FaceAll 131 14 1 2,3,5 2250 15 Lighting7 319 7 5 3,4,6 143 35 Trace 275 4 1 2,3,4 200 30 Two_Patterns 128 4 3 1,2,4 1114 13 CBF 128 3 1 2,3 930 18 Synthetic_Control 60 6 2 1,3,4,5,6 600 25 StarLightCurves 1024 3 3 1,2 9236 7 ElectricDevices 96 7 5 1,2,3,4 16637 2
下载: 导出CSV
表 4 APAKN的
km 值和对比算法的最佳参数值Table 4
km Value of APAKN and the Optimal Parameter Values of Comparison Algorithms数据集 APAKN DBAD SFO DLDE km topt kopt hopt 50words 18 25 9 24 ECG5000 39 31 29 30 FaceAll 25 20 9 15 Lighting7 17 15 16 15 Trace 15 11 10 16 Two_Patterns 54 27 14 18 CBF 66 33 17 30 Synthetic_Control 24 16 11 10 StarLightCurves 74 86 78 59 ElectricDevices 156 91 153 88
下载: 导出CSV
表 5 各算法在 10 个数据集上的精确率和召回率对比
Table 5 Comparison of Accuracy and Recall of Each Algorithm on 10 Data Sets
数据集 APAKN DBAD SFO DLDE 精确率 召回率 精确率 召回率 精确率 召回率 精确率 召回率 50words 1.000 1.000 0.845 0.742 0.462 1.000 1.000 0.673 ECG5000 0.896 0.875 0.663 0.619 0.650 1.000 0.852 0.642 FaceAll 0.912 1.000 0.796 0.842 0.857 1.000 0.743 0.685 Lighting7 1.000 0.917 0.874 0.903 0.579 0.917 0.845 0.683 Trace 0.923 1.000 0.911 1.000 0.727 0.667 1.000 0.967 Two_Patterns 0.954 0.991 0.852 0.800 0.444 0.533 0.845 0.667 CBF 1.000 1.000 0.860 0.914 0.558 1.000 1.000 0.772 Synthetic_Control 1.000 1.000 0.757 0.637 0.735 1.000 1.000 0.700 StarLightCurves 0.912 0.896 0.912 0.845 0.774 0.685 0.875 0.689 ElectricDevices 0.923 0.851 0.845 0.798 0.855 0.762 0.796 0.744 注:黑体数值表示最佳值.
下载: 导出CSV
表 6 各算法在 10 个数据集上的准确率和F值对比
Table 6 Comparison of Accuracy and F Value of Each Algorithm on 10 Data Sets
数据集 APAKN DBAD SFO DLDE 准确率 F值 准确率 F值 准确率 F值 准确率 F值 50words 1.000 1.000 0.914 0.790 0.851 0.632 0.901 0.805 ECG5000 0.996 0.885 0.923 0.640 0.973 0.788 0.865 0.732 FaceAll 0.980 0.953 0.802 0.818 0.961 0.923 0.993 0.713 Lighting7 0.974 0.957 0.826 0.888 0.769 0.710 0.875 0.755 Trace 0.971 0.960 0.871 0.953 0.800 0.696 0.963 0.983 Two_Patterns 1.000 0.972 0.836 0.825 0.876 0.485 0.896 0.746 CBF 1.000 1.000 0.931 0.886 0.940 0.716 0.875 0.871 Synthetic_Control 1.000 1.000 0.860 0.691 0.880 0.847 0.698 0.823 StarLightCurves 0.895 0.904 0.889 0.877 0.852 0.727 0.857 0.771 ElectricDevices 0.924 0.886 0.852 0.821 0.824 0.806 0.869 0.769 注:黑体数值表示最佳值.
下载: 导出CSV
表 7 各算法在 10 个数据集上的ARI和NMI对比
Table 7 Comparison of ARI and NMI of Each Algorithm on 10 Data Sets
数据集 APAKN kmlShape DDC KShape EARI ENMI EARI ENMI EARI ENMI EARI ENMI 50words 0.814 0.825 0.562 0.528 0.524 0.658 0.752 0.635 ECG5000 0.827 0.768 0.662 0.612 0.586 0.693 0.825 0.698 FaceAll 1.000 1.000 0.814 0.802 0.725 0.547 0.408 0.662 Lighting7 0.836 0.905 0.635 0.620 0.433 0.623 0.689 0.814 Trace 0.522 0.734 0.586 0.532 0.425 0.389 0.368 0.647 Two_Patterns 1.000 1.000 0.633 0.396 0.362 0.412 0.453 0.504 CBF 0.925 0.814 0.755 0.852 0.615 0.578 0.847 0.689 Synthetic_Control 0.457 0.667 0.643 0.614 0.303 0.339 0.478 0.713 StarLightCurves 0.956 0.756 0.789 0.812 0.546 0.632 0.874 0.684 ElectricDevices 0.857 0.859 0.478 0.532 0.722 0.566 0.647 0.684 注:黑体数值表示最佳值.
下载: 导出CSV
-
[1] O'Leary B, Reiners J J, Xu Xiaohong, et al. Identification and influence of spatio-temporal outliers in urban air quality measurements[J]. Science of The Total Environment, 2016, 573: 55−65
[2] Qin Yu, Lou Yuansheng. Hydrological time series anomaly pattern detection based on isolation forest[C] //Proc of the 3rd Information Technology, Networking, Electronic and Automation Control Conf (ITNEC). Piscataway, NJ: IEEE, 2019: 1706−1710
[3] Wang Jibin, Wang Ping, Wang Suping. Automated detection of atrial fibrillation in ECG signals based on wavelet packet transform and correlation function of random process[J]. Biomedical Signal Processing and Control, 2020, 55: 101662
[4] Liang Haoran, Song Lei, Wang Jianxing, et al. Robust unsupervised anomaly detection via multi-time scale DCGANs with forgetting mechanism for industrial multivariate time series[J]. Neurocomputing, 2021, 423: 444−462
[5] Wang Xing, Lin J, Patel N, et al. Exact variable-length anomaly detection algorithm for univariate and multivariate time series[J]. Data Mining and Knowledge Discovery, 2018, 32(6): 1806−1844 doi: 10.1007/s10618-018-0569-7
[6] 苏卫星,朱云龙,刘芳,等. 时间序列异常点及突变点的检测算法[J]. 计算机研究与发展,2014,51(4):781−788 Su Weixing, Zhu Yunlong, Liu Fang, et al. A detection algorithm of outlier and mutation points in time series[J]. Journal of Computer Research and Development, 2014, 51(4): 781−788 (in Chinese)
[7] 刘芳,齐建鹏,于彦伟,等. 基于密度的Top-n局部异常点快速检测算法[J]. 自动化学报,2019,45(9):1756−1771 doi: 10.16383/j.aas.c180425 Liu Fang, Qi Jianpeng, Yu Yanwei, et al. A fast algorithm for density-based Top-n local outlier detection[J]. Acta Automatica Sinica, 2019, 45(9): 1756−1771 (in Chinese) doi: 10.16383/j.aas.c180425
[8] Hyndman R J, Wang E, Laptev N. Large-scale unusual time series detection[C] //Proc of the 15th IEEE Int Conf on Data Mining Workshop (ICDMW). Piscataway, NJ: IEEE, 2015: 1616−1619
[9] Senin P, Lin J, Wang Xing, et al. Time series anomaly discovery with grammar-based compression[C] //Proc of the 18th Int Conf on Extending Database Technology(EDBT). New York: ACM, 2015: 481−492
[10] Boniol P, Palpanas T. Series2graph: Graph-based subsequence anomaly detection for time series[J]. Proceedings of the VLDB Endowment, 2020, 13(12): 1821−1834 doi: 10.14778/3407790.3407792
[11] Cheng Kaiwen, Chen Yietarng, Fang Wenhsien. An efficient subsequence search for video anomaly detection and localization[J]. Multimedia Tools and Applications, 2016, 75: 15101−15122
[12] Hawkins D. Identification of outliers[M] //Monographs on Applied Probability and Statistics. Berlin: Springer, 1980: 51−73
[13] Huo Wunjun, Wang Wei, Li Wen. Anomalydetect: An online distance-based anomaly detection algorithm[C] //Proc of the Int Conf on Web Services. Berlin: Springer, 2019: 63−79
[14] Zhang Pengcheng, Xiao Yan, Zhu Yuelong, et al. A new symbolization and distance measure based anomaly mining approach for hydrological time series[J]. International Journal of Web Services Research, 2016, 13(3): 26−45 doi: 10.4018/IJWSR.2016070102
[15] Zheng Dequan, Li Fenghuan, Zhao Tiejun. Self-adaptive statistical process control for anomaly detection in time series[J]. Expert Systems with Applications, 2016, 57: 324−336
[16] Izakian H, Pedrycz W. Anomaly detection in time series data using a fuzzy c-means clustering[C] //Proc of the Joint IFSA World Congress and NAFIPS Annual Meeting (IFSA/NAFIPS). Piscataway, NJ: IEEE, 2013: 1513−1518
[17] Medico R, Spina D, VandeGinste D, et al. Autoencoding density-based anomaly detection for signal integrity applications[C] //Proc of the 27th IEEE Conf on Electrical Performance of Electronic Packaging and Systems (EPEPS). Piscataway, NJ: IEEE, 2018: 47−49
[18] Zhang Chunkai, Chen Yingyang, Yin Ao. Anomaly subsequence detection with dynamic local density for time series[G] //LNCS 11707: Proc of the 30th Int Conf on Database and Expert Systems Applications. Berlin: Springer, 2019: 291−305
[19] Dunn J C. A fuzzy relative of the ISODATA process, and its use in detecting compact well-separated clusters[J]. Journal of Cybernetics, 1973, 3(3): 32−57 doi: 10.1080/01969727308546046
[20] Pedrycz W, Oliveira V. A development of fuzzy encoding and decoding through fuzzy clustering[J]. IEEE Transactions on Instrumentation & Measurement, 2008, 57(4): 829−837
[21] Genolini C, Ecochard R, Benghezal M, et al. kmlShape: An efficient method to cluster longitudinal data (time-series) according to their shapes[J]. PLoS ONE, 2016, 11(6): 1−24
[22] Likas A, Vlassis N, Verbeek J J. The global k-means clustering algorithm[J]. Pattern Recognition, 2003, 36(2): 451−461 doi: 10.1016/S0031-3203(02)00060-2
[23] Ma Ruizhe, Filali S B, Angryk R. Time series distance density cluster with statistical preprocessing[C] //Proc of the 20th Int Conf on Big Data Analytics and Knowledge Discovery. Berlin: Springer, 2018: 371−381
[24] Paparrizos J, Gravano L. K-shape: Efficient and accurate clustering of time series[C] //Proc of the 42nd ACM SIGMOD Int Conf on Management of Data. New York: ACM, 2015: 1855−1870
[25] Breunig M M , Kriegel H P , Ng R T , et al. LOF: Identifying density-based local outliers[C] //Proc of the 28th ACM SIGMOD Int Conf on Management of Data. New York: ACM, 2000: 93−104
[26] Berndt D J, Clifford J. Using dynamic time warping to find patterns in time series[C] //Proc of the Workshop on Knowledge Discovery in Databases. New York: ACM, 1994: 229−248
[27] Cover T, Hart P. Nearest neighbor pattern classification[J]. IEEE Transactions on Information Theory, 1967, 13(1): 21−27 doi: 10.1109/TIT.1967.1053964
[28] Pukelsheim F. The three sigma rule[J]. The American Statistician, 1994, 48(2): 88−91
[29] Pérez-Ortiz M, Durán-Rosal A M, Gutiérrez P A, et al. On the use of evolutionary time series analysis for segmenting paleoclimate data[J]. Neurocomputing, 2019, 326/327: 3−14
[30] Dau H A, Bagnall A, Kamgar K, et al. The UCR time series archive[J]. IEEE/CAA Journal of Automatica Sinica, 2019, 6(6): 1293−1305 doi: 10.1109/JAS.2019.1911747
[31] Qian Pengjiang, Chung Fulai, Wang Shitong, et al. Fast graph-based relaxed clustering for large data sets using minimal enclosing ball[J]. IEEE Transactions on Systems, Man, and Cybernetics, 2012, 42(3): 672−687 doi: 10.1109/TSMCB.2011.2172604
[32] Wang Yangtao, Chen Lihui. K-MEAP: Multiple exemplars affinity propagation with specified K clusters[J]. IEEE Transactions on Neural Networks and Learning Systems, 2016, 27(12): 2670−2682 doi: 10.1109/TNNLS.2015.2495268


计量
- 文章访问数: 226
- HTML全文浏览量: 40
- PDF下载量: 149